Stardust and Eternity – 3.1.8
Classification of Stars
In the field of astronomy, stars are classified according to the features of the spectrum of their electromagnetic radiation. When a beam of white light goes through a prism, or a specific instrument known as “spectrograph”, the light is refracted and decomposed into its component colours, like a rainbow. When analysing the spectra of the Sun and other stars, a rainbow-like spectrum can also be observed, but interspersed by dark lines. Each of these dark “absorption lines” correspond to a specific element that composes the cooler layers of the stellar atmosphere – thus constituting a sort of fingerprint that allows astronomers to probe their atomic compositions.
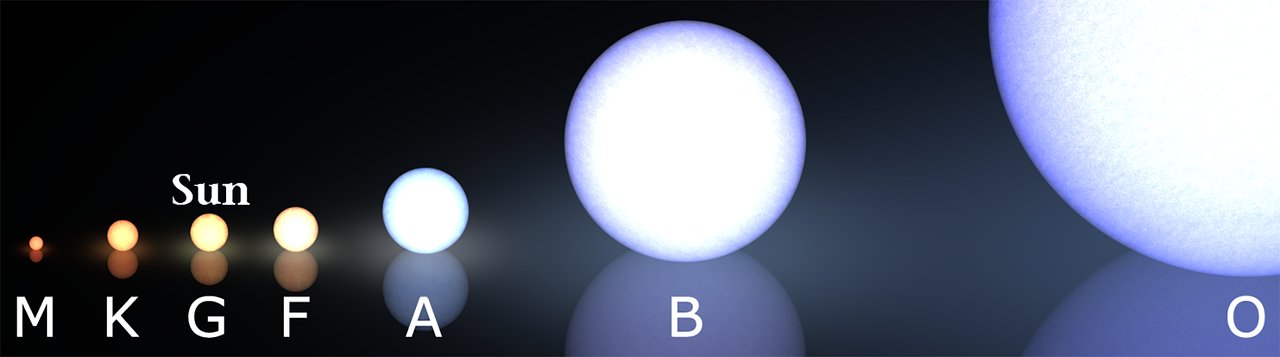
The original star classification was devised in the 1880s and was arranged arbitrarily in alphabetical order (A, B, C,…) based on the strength of particular absorption lines, known to be associated with hydrogen – the most abundant element in stars. Stars with the strongest hydrogen lines were therefore called “A stars”, those with weaker hydrogen lines lines were referred to as “B stars”, and so on. Although the difference in spectra hinted to different elemental compositions, it actually more accurately reflected different surface temperatures (and thus colors). The sequence was later reordered in a non-alphabetical order as O, B, A, F, G, K, M, from the hottest to the coolest stars, easily memorizable as “Oh, Be A Fine Girl, Kiss Me”. The hottest O stars have surface temperatures above 25,000 K, while the coldest stars have temperatures below 3,500 K (the temperature in degrees Kelvins, or K, used in the astrophysical context, is defined as the temperature in degrees Celsius, or °C, plus 273.15). Each class has been further subdivided into 10 subclasses, numbered from 0 to 9. For example, our Sun, whose temperature is about 5,800 K, is listed as a G2 star.
When the observational data of all the different types of known stars are represented in a diagram, with temperatures (or colors) on the horizontal axis and luminosities (or absolute magnitudes, an inverse logarithmic scale) on the vertical axis, we observe that most stars lie in a band that runs diagonally from the top left (brightest and hottest stars) to the bottom right (weaker and colder stars). This diagonal band, in the so-called “Hertzsprung-Russell (H-R) diagram” – named after the two astronomers who devised it – stands for the Main Sequence: all stars within this band (comprising as many as 90% of stellar types) are stable stars that fuse hydrogen nuclei into helium in their cores (like our Sun) for most of their lives. Since luminosity and temperature for Main Sequence stars depend on mass, the Main Sequence represents a trend from high-mass stars (upper left) to low-mass stars (lower right). This stems from the fact that very massive stars produce more energy than lower-mass stars, thus being brighter and hotter. Stars on the far left of the Main Sequence also have a shorter life – being massive, they burn hydrogen at a furious rate and only last a few million years, while stars on its far right are expected to last up to trillions of years! Our Sun, a middle-age star of about 5 billion years, should last at least that long.
However, not all stars are found in the Main Sequence band of the H-R diagram. Some of them can be observed in a narrower band that lies above and to the right from the Main Sequence, towards higher luminosities and lower temperatures. This band consists of aged and unstable “red giant” stars of moderate mass – like our Sun – that evolved away from the Main Sequence after exhausting the hydrogen fuel in their cores, thus becoming larger, redder and brighter as they expanded and cooled on their way to “death”. The most massive stars evolve into “supergiants”, located near the top of the H-R diagram. These stars are very large (even more than a thousand times bigger than the Sun) and due to their very large surface area they are as bright as the very massive but “stable” O stars of the Main Sequence. The “white dwarfs”, stellar “corpses” that represent the last evolutionary stage of low to intermediate mass stars after they have expelled their outer layers in their final stages as red giants, lie in a region near the lower left of the H-R diagram because of their small size and low luminosities.
Further Resources
Links below will redirect you to external websites. In accordance with the European data protection declarations, we would like to point out that by clicking on these links you may send data to external providers. We cannot prevent that.
Images
![]() Stellar classification (ESO, Kheider)
Stellar classification (ESO, Kheider)
![]() Hertzsprung-Russell diagram (ESO)
Hertzsprung-Russell diagram (ESO)
Videos
![]() Classification of Stars: Spectral Analysis and the H-R Diagram
Classification of Stars: Spectral Analysis and the H-R Diagram
![]() Stellar Classification: Types Of Stars!
Stellar Classification: Types Of Stars!
![]() Stellar Classification: What We Can Learn From Stars
Stellar Classification: What We Can Learn From Stars
![]() Stellar Classification 101: Types of Stars and the History of Their Classification
Stellar Classification 101: Types of Stars and the History of Their Classification
 Classificazione stellare: I vari tipi di stelle – Iper COSMOS
LA CLASSIFICAZIONE DELLE STELLE – Antonio Loiacono
Diagramma HR, il censimento delle stelle – Fisica-Mente
Online Resources
![]() Interactive Star Classification chart
Interactive Star Classification chart
![]() Stellar Classification (Britannica.com)
Stellar Classification (Britannica.com)
Classi spettrali e classi di luminosità (Astronomia.com)
Classificazione stellare (Astronomia.cloud)
Further Readings
![]() Astronomical Spectroscopy for Amateurs (Ken M. Harrison)
Astronomical Spectroscopy for Amateurs (Ken M. Harrison)
![]() Using Commercial Amateur Astronomical Spectrographs (Jeffrey L. Hopkins)
Using Commercial Amateur Astronomical Spectrographs (Jeffrey L. Hopkins)
Classificazione spettrale delle stelle (Riccardo Prandi)
CLASSIFICAZIONE SPETTRALE DELLE STELLE, Il ruolo fondamentale della Temperatura (Federico Bertolucci)
Teaching Material
Classificazione spettrale delle stelle (Alessandro Melchiorri – INFN)
Classificazione delle Stelle (Mario Sandri, Christian Stringari)
For Kids
![]() Intro To Stars: Color and Temperature – a song for kids (video)
Intro To Stars: Color and Temperature – a song for kids (video)
Le stelle spiegate ai bambini (Cose per Crescere)