Stardust and Eternity – 3.1.1
Stars Temperature and Colour
When we observe the night sky, we immediately realise that stars do not have the same colour. Most appear white, but some have different hues. This is particularly evident when observing, for example, the distinctive constellation of Orion on clear winter nights: it forms an hourglass-shaped asterism and contains two of the brightest stars in the sky: Rigel, a very hot and massive B-type supergiant star, in the southwest corner, appears bluish-white; Betelgeuse, an M-type supergiant nearing the end of its life, in the north-western corner, appears orange-red. If we consider their effective surface temperatures, the blue Rigel has a temperature of about 11,000 °C, and the red Betelgeuse about 3,200 °C, suggesting a correlation between colour and temperature in stars. By comparison, the Sun – a normal yellow G-type star – has a photospheric temperature of about 5,500 °C. Actually, the colour of a star only tells us about the temperature at its emission surface, as the stellar interior (where thermonuclear reactions take place) is millions of degrees hotter.
The reason behind the correlation between colour and temperature lies in the particular way objects emit their intrinsic electromagnetic radiation. In fact, every object at normal temperature – even if it does not glow – emits infrared radiation. But if we heat the same object, its temperature increases and the peak of the radiation shifts from the redder part of the spectrum towards shorter (bluer) wavelengths. Stars, being giant gaseous spheres, despite their complexity, emit their radiation following a simple theoretical model – just like objects heated on a stove. This model is called “blackbody” radiation. Blackbodies are ideal objects that emit electromagnetic radiation only because of their temperature, regardless of their composition. The intensity of the radiation emitted by such blackbodies at a specific temperature at all wavelengths – the so-called “spectral profile” – takes on a characteristic bell-shape. As temperature increases, the peak of the bell-shaped blackbody profile shifts toward shorter (bluer) wavelengths. Conversely, as temperature decreases, the peak shifts toward longer (redder) wavelengths. This explains why stars, which often come close to having a blackbody spectrum, have different colors according to their temperatures. The spectrum of a star can be measured with an instrument called a “spectrograph”: the wavelength at which the spectrum peaks corresponds to the temperature of the star’s surface.
Besides obtaining the full spectrum of the star, its temperature can be determined more simply by comparing its brightness at only two different wavelengths. This can easily achieved by using an optical filter, a piece of coloured glass that lets through only a selected range of wavelengths. For example, a «B» filter lets through blue light with a wavelength of about 440 nanometers, while a visual «V» filter lets through only yellow-green light with a wavelength of about 550 nanometers. The difference «B – V» between the brightness measurements on a logarithmic scale (or apparent magnitude) of the two filters gives the so-called “colour index” of the star: the lower this index, the hotter (bluer) the star, and vice versa. The zero point is conventionally chosen for a star like Vega, the fifth brightest star in the night sky, which is white in colour and has a surface temperature of 7,100 °C – so that hot (cold) stars have negative (positive) colour indices. Our Sun has a colour index of +0.66, and is therefore colder than Vega. The actual temperature of the star can finally be calculated directly with simple analytical formulas from the colour index.
Further Resources
Links below will redirect you to external websites. In accordance with the European data protection declarations, we would like to point out that by clicking on these links you may send data to external providers. We cannot prevent that.
Images
![]() Sunlight Spread Out into a Spectrum (NASA, ESA, Leah Hustak (STScI)
Sunlight Spread Out into a Spectrum (NASA, ESA, Leah Hustak (STScI)
![]() Spectroscopic Observations of Different Wavelengths of Light in Astronomy (NASA, ESA, Leah Hustak (STScI)
Spectroscopic Observations of Different Wavelengths of Light in Astronomy (NASA, ESA, Leah Hustak (STScI)
![]() Spectrum of the Star Altair (NASA, ESA, Leah Hustak (STScI)
Spectrum of the Star Altair (NASA, ESA, Leah Hustak (STScI)
![]() Continuous Spectra (Blackbody Curves) of Stars (NASA, ESA, Leah Hustak (STScI), Andi James (STScI)
Continuous Spectra (Blackbody Curves) of Stars (NASA, ESA, Leah Hustak (STScI), Andi James (STScI)
![]() Structure of stars (ESO)
Structure of stars (ESO)
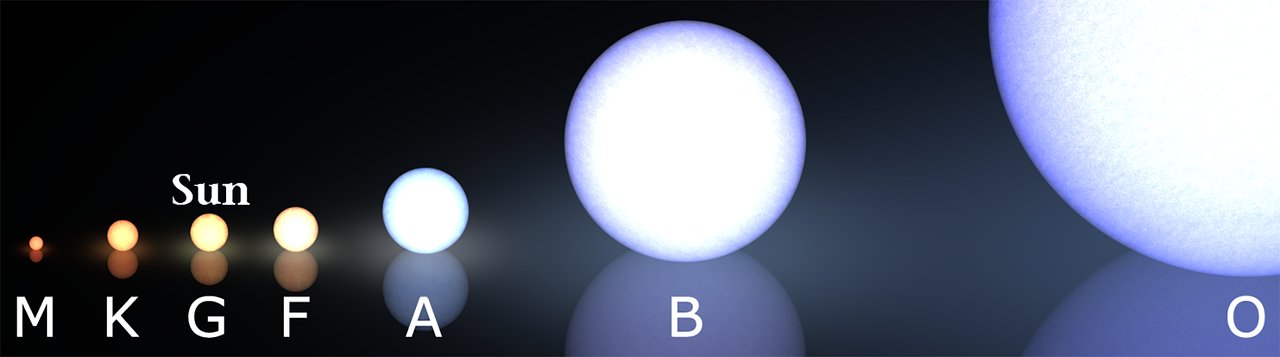
![]() The sizes of stars (ESO/M. Kornmesser)
The sizes of stars (ESO/M. Kornmesser)
![]() The nearest stars to the Sun (IEEC/Science-Wave – Guillem Ramisa)
The nearest stars to the Sun (IEEC/Science-Wave – Guillem Ramisa)
![]() 3D map of stellar systems in the solar neighbourhood (ESO/R.-D.Scholz et al. (AIP)
3D map of stellar systems in the solar neighbourhood (ESO/R.-D.Scholz et al. (AIP)
![]() Star colors in Orion (APOD/Jens Hackmann)
Star colors in Orion (APOD/Jens Hackmann)
![]() Sagittarius star cloud (APOD/AURA, STScI, NASA, Hubble Heritage Project (STScI, AURA))
Sagittarius star cloud (APOD/AURA, STScI, NASA, Hubble Heritage Project (STScI, AURA))
Videos
![]() Stars 101 | National Geographic
Stars 101 | National Geographic
![]() Stars: Crash: Course Astronomy
Stars: Crash: Course Astronomy
![]() Light: Crash: Course Astronomy
Light: Crash: Course Astronomy
 La classificazione delle stelle – Antonio Loiacono
Caratteristiche delle stelle – Antonella Mortaro
Online Resources
![]() The Colors of the Stars From Hottest to Coldest
The Colors of the Stars From Hottest to Coldest
![]() Types of Stars (astrobackyard.com)
Types of Stars (astrobackyard.com)
![]() The colour of stars (Australia Telescope National Facility)
The colour of stars (Australia Telescope National Facility)
![]() The color of stars (Clarkvision.com)
The color of stars (Clarkvision.com)
![]() The electromagnetic spectrum (NASA – Goddard Space Flight Center)
The electromagnetic spectrum (NASA – Goddard Space Flight Center)
![]() Blackbody spectrum simulation (University of Colorado)
Blackbody spectrum simulation (University of Colorado)
Il colore delle stelle – EduINAF
Qual è il colore predominante nell’Universo? – Focus
Gli astronomi sono in fermento per lo strano comportamento di una stella gigante – National Geographic Italia
Betelgeuse, la stella supergigante rossa, si sta contraendo – Focus
Da rosse a blu: perché le stelle hanno colori diversi? La spiegazione scientifica – Geopop
Further Readings
![]() Stars and Their Spectra: An Introduction to the Spectral Sequence (James B. Kaler)
Stars and Their Spectra: An Introduction to the Spectral Sequence (James B. Kaler)
![]() Guide to the Universe: Stars and Galaxies (Lauren V. Jones)
Guide to the Universe: Stars and Galaxies (Lauren V. Jones)
Un diagramma colore-magnitudine per le Pleiadi (Michael K. Gainer)
Teaching Material
![]() Color of stars (CourseHero)
Color of stars (CourseHero)
For Kids
![]() Intro to stars: color and temperature (video)
Intro to stars: color and temperature (video)
![]() What color are the stars? (video)
What color are the stars? (video)
![]() What are stars? (video)
What are stars? (video)
![]() Star Personalities: Crash Course Kids (video)
Star Personalities: Crash Course Kids (video)
![]() Glow On: Crash Course Kids (video)
Glow On: Crash Course Kids (video)
![]() All About Stars for Kids: Astronomy and Space for Children – FreeSchool
All About Stars for Kids: Astronomy and Space for Children – FreeSchool
Nane e Supergiganti – ESA – Space for Kids
Le stelle spiegate ai bambini (video)