Passion of the People – 1.7.2
How Do We Quantify Light Pollution?
Light pollution can be defined as the presence of unwanted, inappropriate or excessive artificial lighting. In particular, artificial light at night (ALAN) is a current phenomenon and, despite its obvious benefits, it presents various negative aspects, which are studied across multiple fields, including astronomy. Therefore, it is becoming increasingly important to be able to properly measure light pollution.
At present, there are many measurement tools at disposal. Their use is often context or field-related and, of course, they all present limitations, such as accuracy or costs. Some of the main devices for quantifying light pollution are illustrated hereafter.
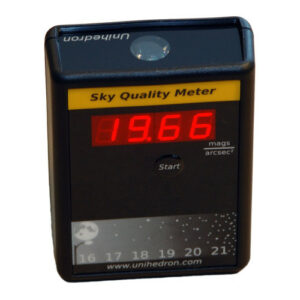
Sky Quality Metres (SQM)
Sky Quality Metres (SQM) are the most widely used device to take scientific-quality measurements of sky brightness at night. This is certainly due to their affordability, but not only. Indeed, SQMs are also quite easy to use with some precautions, essentially you need to “hold the device above your head, point the photometer at the zenith, and push the button”, by repeating these steps you will be able to take multiple measurements per location.
In fact, SQMs are sensitive to visual light and they measure the brightness of the night sky in magnitudes per square arcsecond, i.e. the brightness, which is expressed using the magnitude logarithmic scale, of a square arcsecond of sky.
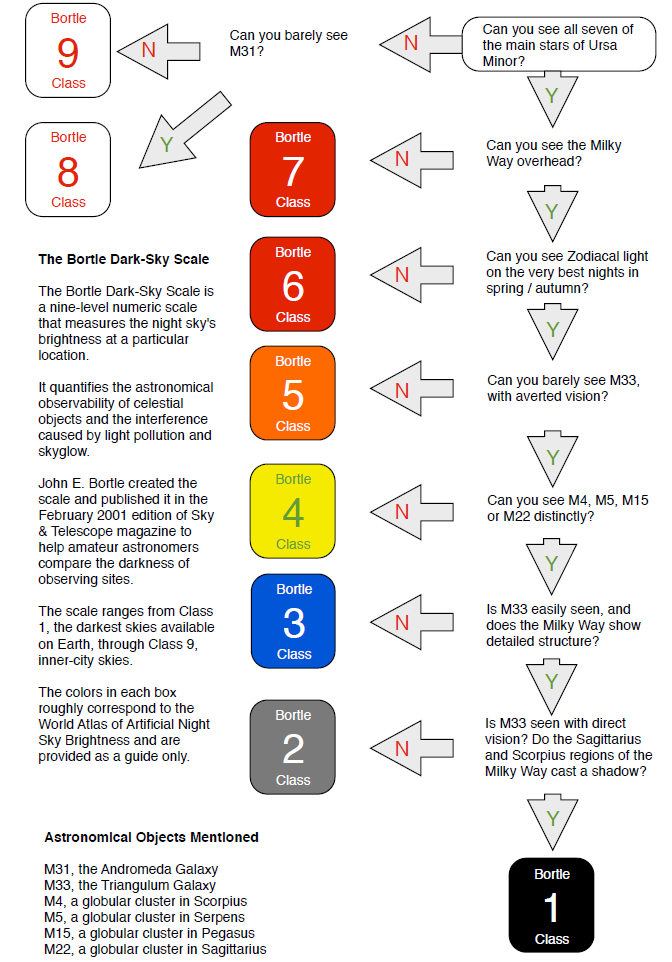
Furthermore, the results of these measurements, namely the SQMs readings, can be paired with the adequate level of the Bortle Scale, the latter being a nine-level numeric scale, created by John E. Bortle in February 2001, with the purpose of measuring how bright the night sky is in a location according to what celestial objects are or are not visible and regardless of the equipment at disposal. This method can be considered a marked improvement over the previous naked-eye limiting magnitude (NELM) measurements, which were less rigorous and deeply conditioned by the specific observer’s eyesight.
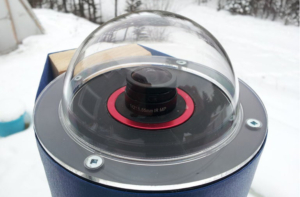
All-Sky Cameras
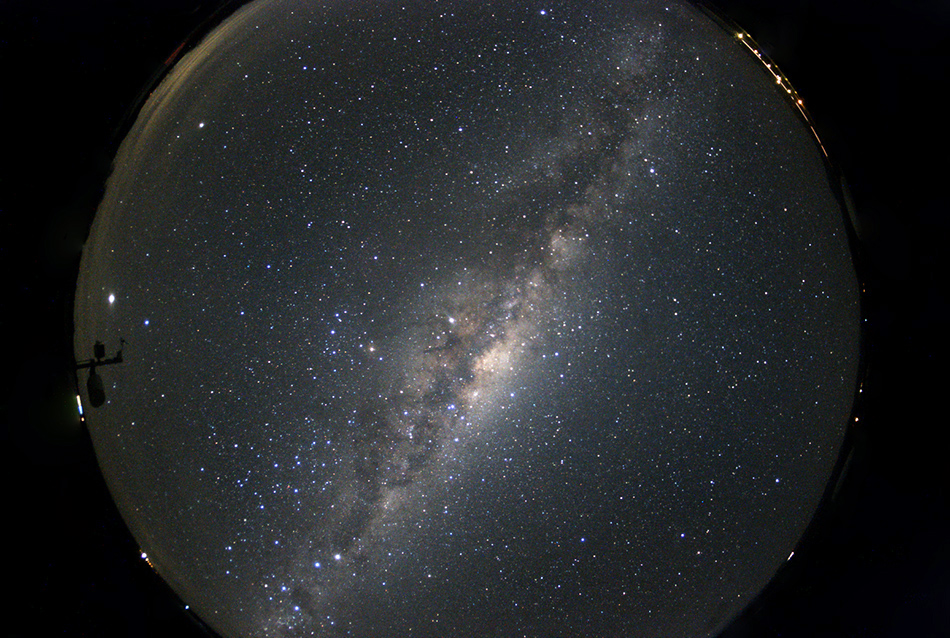
All-Sky cameras are designed to take pictures of the entire sky over a certain amount of time, usually in order to monitor astronomical phenomena. This kind of camera has recently emerged as a valid tool for measuring the brightness of the night sky and, consequently, light pollution levels.
There are several types of all-sky cameras, for instance, it suffices to combine a digital camera with a fisheye lens, to calibrate the device and to point it to zenith, i.e. the point in the sky directly above the observer, in order to create a proper ground-based imaging sensor capable to produce all-sky measurements of light pollution.
Furthermore, all-sky cameras preferably make use of a SQM software that calibrates and enhances the data obtained, thus, for instance, separating light pollution from other astronomical phenomena that can be observed in the resulting imaging.
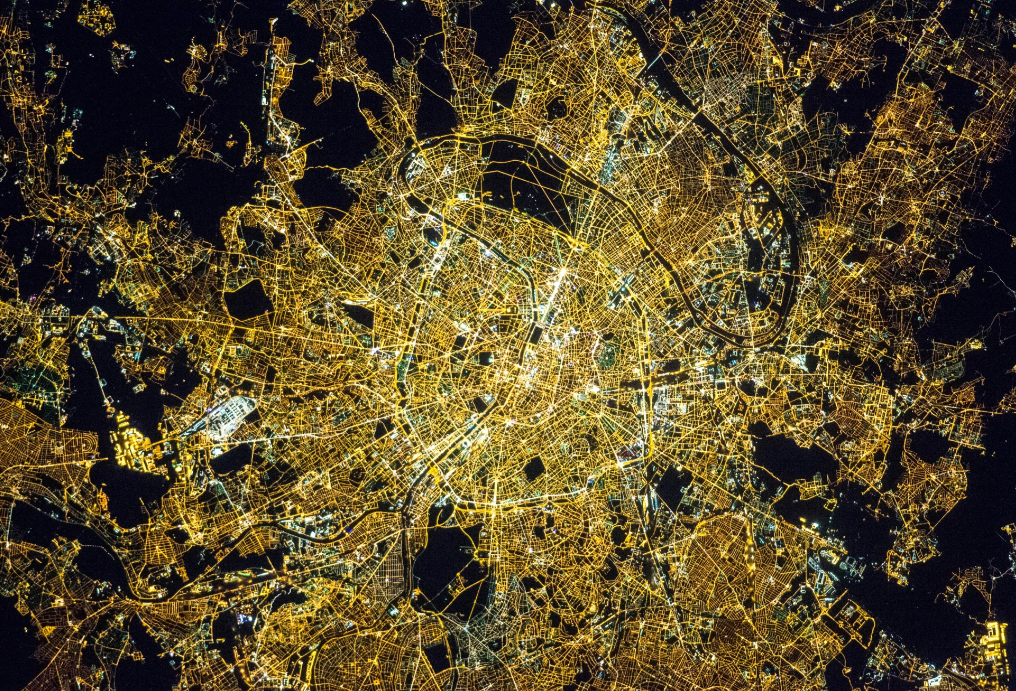
Satellites
Satellites provide another effective method for the measurement of light pollution. Indeed, light pollution can be easily perceived with the naked eye at night as a haze of light above many cities. This dome of skyglow is nothing but the scattering of artificial light at night (ALAN), which is in part scattered back to the ground and in part detected by satellites. Hence, spaceborne sensors, by measuring upward light, can quantify the amount of light pollution obscuring the stars.
Today, there are several satellites used to research light pollution and also many public websites that show light pollution maps provided by satellite imaging, such as the World Atlas of Artificial Sky Brightness, the Dark Site Finder, and the Light Pollution Map. Nevertheless, it is important to mention that artificial satellites can be considered a source of light pollution in their turn, especially those located in low Earth orbits.
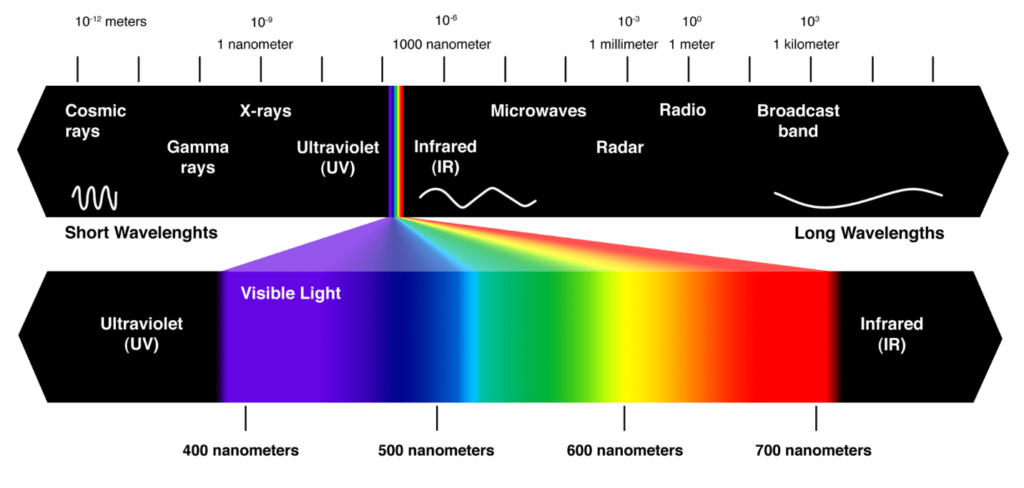
The Light Pollution Spectrum
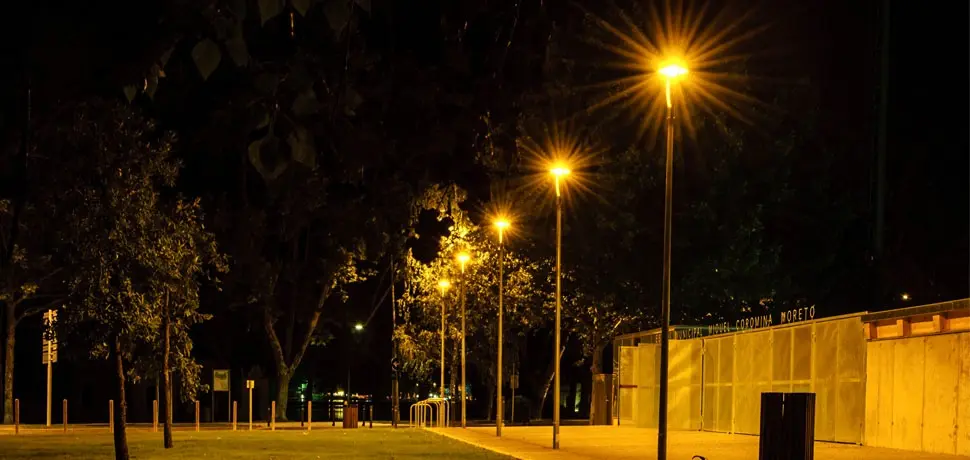
Finally, when illustrating the measurement tools used to quantify light pollution, it is essential to identify the emission spectrum of reference, namely that of a light pollution source such as street lights. Indeed, this is a determining factor for modelling artificial light at night (ALAN).
According to NASA, the visible light spectrum can be defined as “the segment of the electromagnetic spectrum that the human eye can view.” Within the visible light spectrum, it is possible to identify different types of ALAN. For instance, the warm light of incandescent bulbs and the cold light of LEDs are quite clearly at opposite ends of the visible light spectrum.
Indeed, although LEDs are both cheaper and more energy-efficient and, therefore, widely used, they are actually worsening light pollution and making the observation of dark skies increasingly difficult, due to the higher scattering level of the blue light they emit.


Further Resources
Links below will redirect you to external websites. In accordance with the European data protection declarations, we would like to point out that by clicking on these links you may send data to external providers. We cannot prevent that.
Videos
![]() Light Pollution 101 – National Geographic
Light Pollution 101 – National Geographic
![]() Where Are the Stars? See How Light Pollution Affects Night Skies – National Geographic
Where Are the Stars? See How Light Pollution Affects Night Skies – National Geographic
![]() Why you should care about light pollution – DW Planet A
Why you should care about light pollution – DW Planet A
![]() Huge loss of stars visible in night sky due to light pollution say scientists – BBC News
Huge loss of stars visible in night sky due to light pollution say scientists – BBC News
 Italia maglia nera per l’inquinamento luminoso – MEDIAINAF TV
Troppi satelliti in orbita e inquinamento luminoso impattano sulle osservazioni astronomiche – Università di Padova
Gli spettri di emissione – Edizioni Atlas
Online Resources
![]() How to measure light pollution—A systematic review of methods and applications
How to measure light pollution—A systematic review of methods and applications
![]() Sky Quality Meter measurements in a colour-changing world
Sky Quality Meter measurements in a colour-changing world
![]() How Dark is My Sky? An Astronomer’s Guide to the Bortle Scale – Love the Night Sky
How Dark is My Sky? An Astronomer’s Guide to the Bortle Scale – Love the Night Sky
![]() Sky Quality Meter Reading – Astrotourism Western Australia
Sky Quality Meter Reading – Astrotourism Western Australia
![]() How Dark is Your Night Sky? – Stargazers
How Dark is Your Night Sky? – Stargazers
![]() How To Conduct A Night Sky Quality Survey – International Dark-Sky Association (IDA)
How To Conduct A Night Sky Quality Survey – International Dark-Sky Association (IDA)
![]() Eyes In The Sky: Exploring Global Light Pollution With Satellite Maps – International Dark-Sky Association (IDA)
Eyes In The Sky: Exploring Global Light Pollution With Satellite Maps – International Dark-Sky Association (IDA)
![]() Picture imperfect: light pollution from satellites is becoming an existential threat to astronomy – The Guardian
Picture imperfect: light pollution from satellites is becoming an existential threat to astronomy – The Guardian
![]() All Sky Camera Observations of Cloud and Light Pollution at Thirty Meter Telescope Candidate Site
All Sky Camera Observations of Cloud and Light Pollution at Thirty Meter Telescope Candidate Site
![]() Tour of the Electromagnetic Spectrum – Visible Light – NASA Science
Tour of the Electromagnetic Spectrum – Visible Light – NASA Science
![]() The environmental consequences of LEDs – Spectrum News 1
The environmental consequences of LEDs – Spectrum News 1
![]() Bright LEDs could spell the end of dark skies – MIT Technology Review
Bright LEDs could spell the end of dark skies – MIT Technology Review
![]() These Energy-Saving Bulbs Are Making One Pollutant Much Worse – National Geographic
These Energy-Saving Bulbs Are Making One Pollutant Much Worse – National Geographic
![]() Effects of the COVID-19 lockdown on urban light emissions: ground and satellite comparison
Effects of the COVID-19 lockdown on urban light emissions: ground and satellite comparison
Luci e buio: tecniche e dati per lo studio dell’inquinamento luminoso – ARPA Veneto
Inquinamento luminoso e insetti: un nuovo studio scientifico
Non riusciremo più a riveder le stelle – Valentina Guglielmo INAF
L’inquinamento luminoso è in rapido aumento – Il Post
E’ vero che i satelliti in orbita causano inquinamento luminoso? – ANSA
Satelliti e inquinamento luminoso: osservazioni astronomiche sempre più difficili – Università di Padova
Sulla Terra non c’è più un luogo immune dall’inquinamento luminoso – Focus
Quanto è Buio il Cielo di Notte? – Meteo Planet
L’inquinamento luminoso – Cielo Buio
Spettro di emissione – Chimica online
Further Readings
![]() Light Pollution : Responses and Remedies – Bob Mizon
Light Pollution : Responses and Remedies – Bob Mizon
Teaching Materials
![]() A Collection of Light Pollution Lesson Plans for Educators – International Dark-Sky Association (IDA)
A Collection of Light Pollution Lesson Plans for Educators – International Dark-Sky Association (IDA)
Innovazioni tecniche per la riduzione dell’inquinamento luminoso negli impianti di illuminazione esterna – Università degli studi Guglielmo Marconi
Parametri tecnici per la limitazione dell’inquinamento luminoso – Mario di Sora
For Kids
![]() Light Pollution | Reasons and Effects | Video for Kids – Learning Junction
Light Pollution | Reasons and Effects | Video for Kids – Learning Junction
![]() Save the Sky by Bethany Stahl | Children’s Animated Audiobook | A Story About Light Pollution – Bethany Stahl
Save the Sky by Bethany Stahl | Children’s Animated Audiobook | A Story About Light Pollution – Bethany Stahl